ROI Overview
Introduction
The Region of Interest (ROI) tool calculates the average density and the standard deviation of that ROI. You can perform ROI measurements on an image with the following ROI types: rectangular, elliptical, polygonal, freehand, and auto detected (2pt).
Annotation Measurements
Each of these annotations includes the following measurements:
- Area - defined in square inches, square centimeters, or square millimeters
- Perimeter - defined in inches, centimeters, or millimeters
- Mean - calculated as average density (digital) value within the area of the annotation
- Standard Deviation - calculated from all density values within the ROI area to quantify the extent of the digital value variance
- Maximum Value - defined as the largest density value within the ROI
- Minimum Value - defined as the smallest density value within the ROI
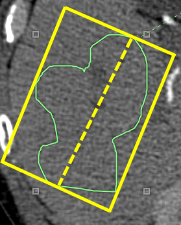
- Length of Major Axis - defined as the longest line that connects the most distant points on the edge of the ROI
- Length of Minor Axis - calculated by drawing lines that are parallel and perpendicular to the major axis (shown as the dotted yellow line in the illustration) forming a rectangle (shown as solid yellow box) that contains the ROI. The minor axis is the length of the box that is perpendicular to the major axis
|
Note: |
|
Freehand ROI
A Freehand ROI can be drawn to measure arbitrary points on the image. If you use the freehand ROI to draw an open freehand curve, Synapse measures the length of the freehand annotation.
Related Topics
Customizing Measurements for Annotations