Worklist Features
|
|
The Worklist reopens to the same size and position it was in when you closed it. |
|
Feature |
Description |
|---|---|
|
Worklists Pane |
Displays
the four default Worklists (All Patients, All Recent Studies,
All Studies, and Unread Studies), any SWAT created Worklists configured
for your site, the QBE (Query By Example) Worklists that you have
created and saved, Global Worklists, My History, My Favorites,
and your Collections folders. Click the twistie |
|
Time Warp buttons |
Allows navigation between previously opened studies. |
|
Worklist
Item Count |
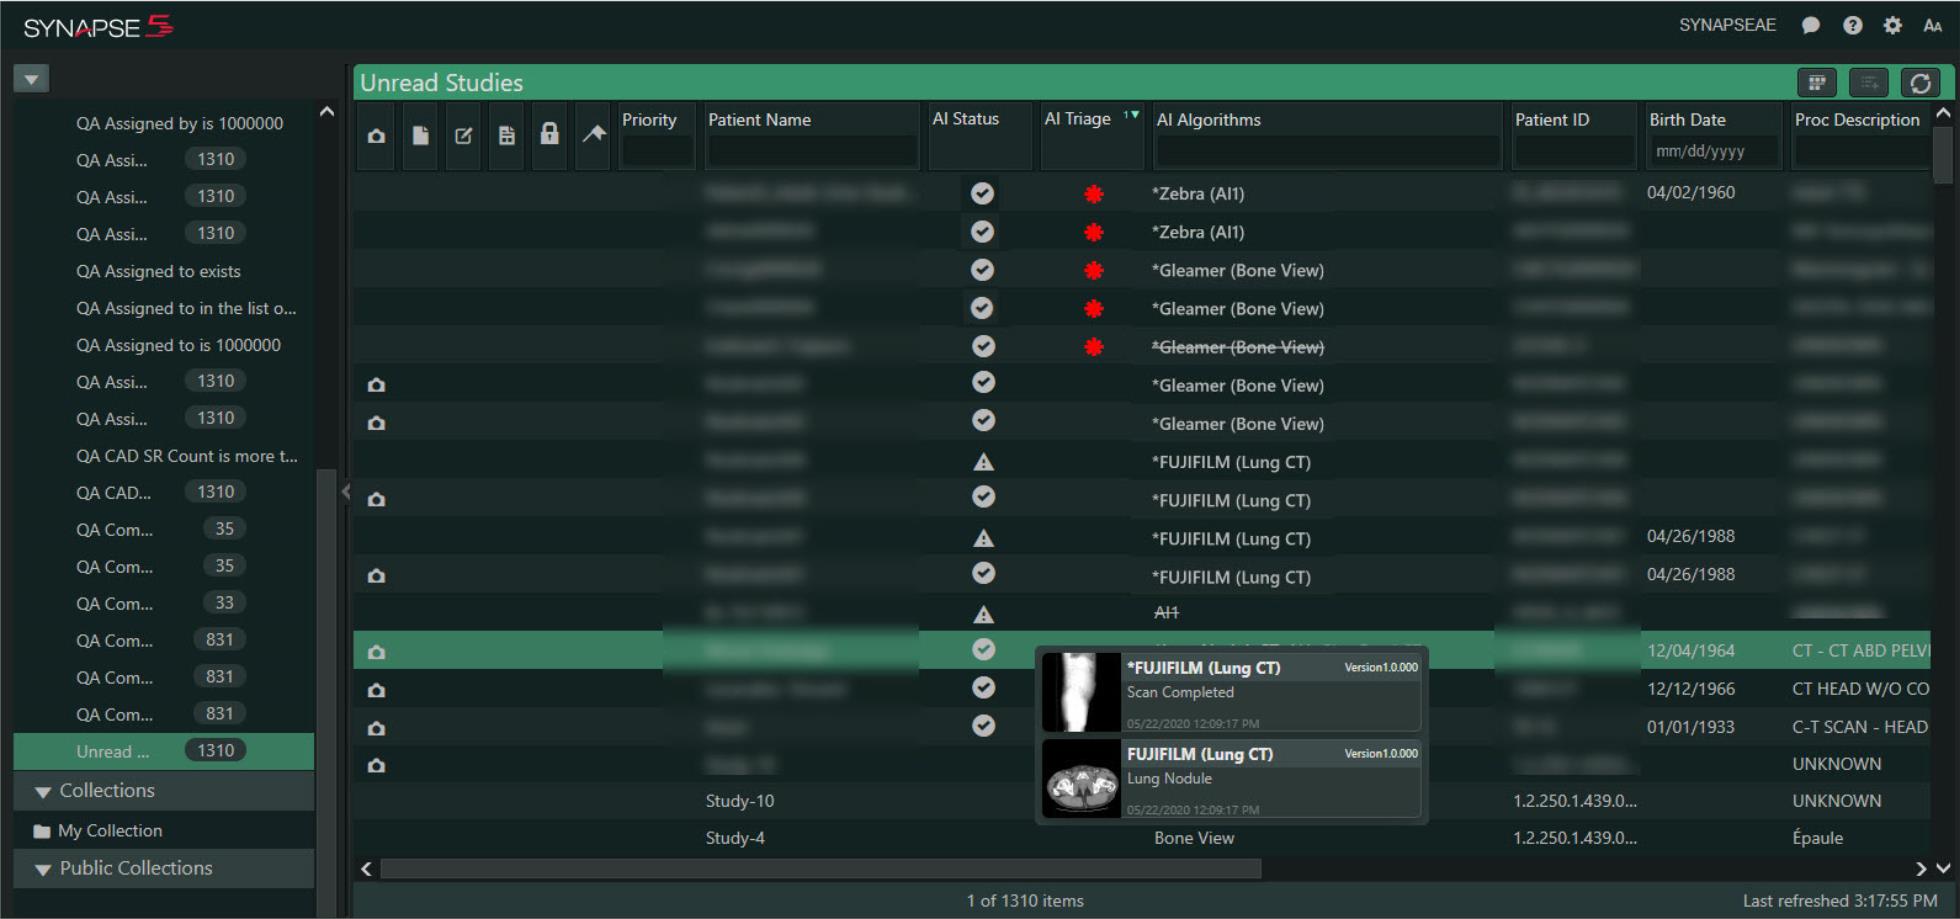
Displays the number of available studies. Two counts display: the first count displays the number of Unread Studies and second count displays the STAT priority studies in red.
Note: If the number of studies in the Unread Studies Worklist equals or exceeds 10,000 studies, study counts will not display. |
|
Worklist Title Bar |
Displays the name of the selected Worklist,
the View All Thumbnails icon, the Create a QBE Worklist icon,
and a Refresh icon. |
|
Columns Names |
Each default Worklist displays its own
set of columns. Column names can only be modified by your PACS
System Administrator. |
|
Column Selection |
The
Worklist includes a large number of column options from which
to select. Customize your Worklist columns to best meet your needs. |
|
Row Selection |
Click a row to select the single row (study).
|
|
Context Menu |
Right-click a study to access the context
menu options. |
|
Refresh Time |
Displays the time of the most recent system refresh. |
 next to a Worklist header to expand or collapse the contents beneath
it.
next to a Worklist header to expand or collapse the contents beneath
it.
Worklist Indicator Icons
|
Icon |
Description |
|---|---|
|
|
Synapse Chat provides the ability for Synapse users to communicate with
one another within the Synapse application. Click the Synapse Chat icon from
your preferred location in the Worklist, PowerJacket, or Viewer. |
|
|
Click the Resize Font icon located in the top right of the Worklist page to adjust the font size of Worklist. Use this feature to make the font smaller or larger without affecting your browser settings. |
|
|
The Snapshot icon indicates that the study contains saved display states. Right-click to display the context menu that lists the display states. Click to view or drag Snapshots into the Collections folder. Right-click to invoke the Snapshot context menu. Options include the ability to edit a Snapshot's name or delete from the study. All changes automatically synchronize in the Viewer. Note that auto-saved Snapshots cannot be deleted. |
|
|
The Reports icon indicates that the study includes a report.
|
|
|
The Notes icon indicates that the study includes notes.
|
|
|
The Documents icon indicates that the study includes documents.
|
|
|
The Reservations icon indicates that the study is reserved for a specific user.
|
|
|
Click the View
All Thumbnails icon to display the thumbnails for every
study under each study row, so you can quickly determine whether
you want to open the study to view more images and information. |
|
|
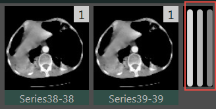
If more thumbnails exist than there are columns to display them, an indicator displays on the right side of the thumbnails preview indicating that additional series are available. Open the study to view additional series. |
|
|
Click the Save the QBE Worklist icon
when you want to create a (Query By Example) QBE Worklist. |
|
|
Click the Refresh icon to manually refresh the contents of the Worklist page and view the most current information on your Worklist and in the Worklist pane.
Note: The contents of the Unread Studies folder refresh automatically at an interval set by your System Administrator. |
|
|
The Collections
folder icon displays next to your default My Collections folder
and any other Collections folders you create. |
|
|
The Worklist page displays the Lock (concurrency) icon to indicate that other users with dictation privileges currently have the study open. Hover over the icon to view a list containing the name of the user or users who have the study currently open and how long the study has been open. If another user with dictation privileges currently has the study open and you open it too, a concurrency warning displays the names of the other user or users who have the study open. You are prompted to click OK to open the study or click Cancel to not open the study. |
|
|
Use Subscriptions to select any unread Worklist or unread Global Worklist in order to pre-cache the images of up to 10 studies. Pre-caching images significantly reduces the wait time sometimes associated with the retrieval of archived images. If you work remotely, or the network you use has low bandwidth, this feature will be especially useful. |
|
|
AI Submitted: This icon displays when a study has been queued for AI processing consideration. |
|
|
AI In Progress: This icon displays as the AI engine processes the study. Once the study is processed and the Worklist refreshes, the appropriate icon displays. |
|
|
AI Scan Complete: This icon displays when the AI scan is fully processed. |
|
|
AI Failure / Rejected: This icon displays when the AI platform communicates a failed or rejected status to Synapse. |